
Blog


Color Image Analysis of Optical Systems
In:
Introduction
The spectral distribution of a broadband light source is essential for many optical systems, ranging from white light illuminators to spectrometers. FRED's Color Image analysis feature allows for the visualization of color distribution by calculating chromaticity coordinates for each pixel and displaying the resulting RGB values on the surface. Additionally, a color chromaticity diagram is presented, showing the chromaticity coordinates of each pixel when the cursor moves across the graph. This application note examines the Color Image from two optical systems. The first system uses a dichroic “cold mirror” to split white light into two wavelength bands. The second system employs a linear polarizer and a waveplate to demonstrate the wavelength dependence of birefringent materials.
Examples
Dichroic Cold Mirror
In FRED, multilayer filters can be created by right-clicking Coatings → Create a New Coating. Several coating types are available, such as Sampled Coating, Thin Film Layered Coating, Quarter Wave Single Layer Coating, General Sampled Coating (angle of incidence, wavelength, and polarization-dependent), Polarizer/Waveplate Coating (Jones matrix), and Script Coating. For this example, a cold mirror is created using the Thin Film Layered Coating type.

Figure 1. Cold mirror coating specifications.
The Cold Mirror Coating is applied to one surface of a plane parallel plate. The plate is illuminated with a white light source, evenly sampled from 400-700 nm. The source rays originate within a small volume at the focal point of a parabolic mirror. Light reflected by the mirror is quasi-collimated and directed toward the cold mirror, which is rotated 50° relative to the beam. Two absorbing planes are positioned to collect light reflected and transmitted by the cold mirror.

Figure 2. Illuminated cold mirror layout (left). Color image of reflected and transmitted beams (right).
Spectral analysis of the light reflected and transmitted by the cold mirror shows that because the coating was specified for 0.55 μm at 0° angle of incidence, a shorter central wavelength is reflected at this larger angle of incidence.
Figure 3. Spectral analysis of light reflected and transmitted by the cold mirror.
Color Images of the quasi-collimated white light beam, transmitted beam, and reflected beam reveal the distinct color separation.

Figure 4. Color Images of the quasi-collimated white light beam (left), transmitted beam (center), and reflected beam (right).
The average chromaticity coordinates for the reflected and transmitted components of the beam are indicated by crosshairs in the diagram. This value is determined by reducing the analysis surface to one pixel and evaluating its Color Image.

Figure 5. Average chromaticity coordinates for reflected (left) and transmitted (right) components of the beam.
Waveplate and Linear Polarizer
In this setup, coherent horizontally-polarized white light is focused by a lens. A waveplate is placed beyond the focal point, followed by a vertical linear polarizer.

Figure 6. Simplified Astigmatic Gaussian Beam specifications.
Without a waveplate, the irradiance distribution beyond the vertical polarizer shows that vertical polarization components of rays in the expanding beam pass through.

Figure 7. Irradiance distribution beyond vertical polarizer if waveplate is neglected.
Next, a waveplate is added (0.00304 mm thick plate made from birefringent calcite). To create calcite, right-click Material → Create a New Material and choose the category “Sampled Birefringent and/or Optically Active Material”. Specifications for calcite are shown below.

Figure 8. Ordinary and extraordinary components of the index of refraction of calcite are specified.
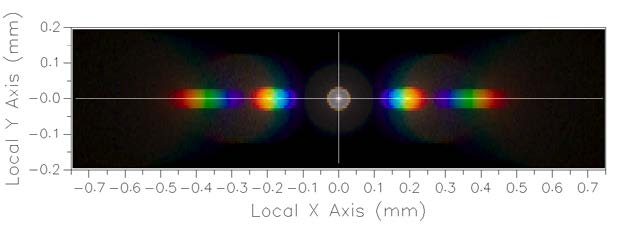
The waveplate provides a differential phase shift for each polarization component of light passing through. The wavelength-dependence of this phase shift means that each color component of the beam undergoes a slightly different polarization adjustment. The vertical polarizer filters out all horizontal polarization components of the light. With the waveplate, the irradiance beyond the polarizer shows a reduction in the extinction cross pattern. A more interesting view of the light distribution is its Color Image, which displays an iridescent color distribution.

Figure 9. Irradiance distribution (left) and Color Image (right) of light after passing through a birefringent waveplate and vertical linear polarizer.
FRED's Color Image analysis provides a powerful tool for visualizing the spectral distribution in optical systems. By examining the color distribution and chromaticity coordinates, engineers can gain insights into the performance and behavior of various optical components, such as dichroic mirrors and birefringent materials. This capability is crucial for optimizing the design and functionality of advanced optical systems.
___________________________________________________________________________________________________________________________________________________________________________________
This blog post was created based on the information provided by Photon Engineering, a partner of CBS Europe.
Download the PDF: Color Image Analysis of Optical Systems