
Blog


Exploring Fourier Transform Spectroscopy with FRED
In:
Fourier Transform Spectroscopy (FTS) is a powerful method used in various fields to analyze the spectrum of a source. Unlike traditional monochromators, FTS offers increased measurement speed, higher resolution, and mechanical simplicity. This blog post delves into the essentials of FTS and demonstrates how to model and operate a Fourier transform spectrometer using FRED software.
Introduction to Fourier Transform Spectroscopy
A Fourier transform spectrometer utilizes an interferometer with a translating mirror to produce an interferogram. The Fourier transform of this interferogram reveals the spectrum of the source. FTS is often preferred due to its superior capabilities compared to monochromators, such as faster measurements and enhanced resolution.
Building the Spectrometer in FRED
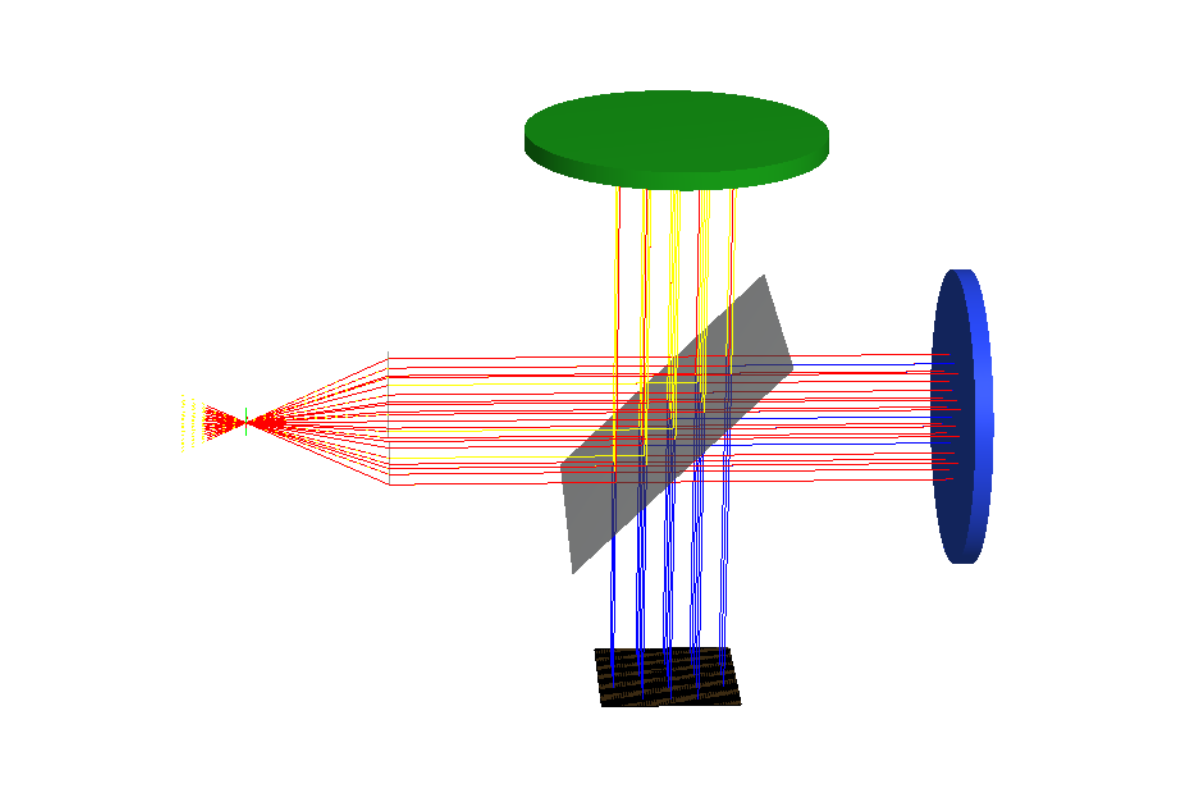
To build a Fourier transform spectrometer in FRED, we start with a simplified model using ideal components: a point source, lens, and beamsplitting surface.
Steps to Create the Model:
- Create a coherent point source object.
- Assign a spectrum to the source, which can be imported, digitized, or calculated.
2. Lens and Beamsplitter
- Add a custom element with a “Lens Module” surface, having a focal length of 10 mm and a semi-aperture of 5 mm.
- Create a surface at a 45-degree angle to the collimated beam and apply a custom 50/50 beamsplitting coating.
3. Mirrors and Absorbing Surface:
- Place two mirror objects with “Reflect” coatings at distances of 20 mm from the beamsplitter in the +y and +z directions.
- Add an absorbing surface and an analysis surface normal to the combined beam exiting the beamsplitter.

Figure 1: Simple Fourier transform spectrometer model, consisting of a point source, ideal lens, and Michelson interferometer with a moving mirror.

Figure 2. Custom 50/50 beamsplitter coating specifications. If a single wavelength is specified, the coating will apply identically to all wavelengths in the source.
Operating the Spectrometer to Recover Source Spectrum
To gather spectral information, one mirror in the interferometer must translate to change the optical path difference (OPD). As the mirror moves, power on the detector is collected at each step, forming an interferogram. A fast Fourier transform (FFT) of this interferogram reveals the source's spectrum.
Example 1: Single-Wavelength Source
For a single-wavelength source at 1.5 µm, the interferogram is a cosine function, and the recovered spectrum shows a distinct peak at the corresponding spatial frequency.

Figure 3: Single-wavelength source spectrum evaluated by a FTS.
Example 2: Gaussian Spectrum
The source is given a Gaussian spectrum with center wavelength of 0.555 μm and half width at half max of 0.0589 μm. The central wavelength corresponds to a spatial frequency of 1801.8 (1/mm). Note that the recovered spectrum has an apparent asymmetry (Figure 4). This is because the spectrum is a Gaussian function of wavelength, and spatial frequency the inverse of wavelength. Shorter spatial frequency intervals correspond to a larger range of wavelengths; thus, the left half of the recovered spectrum will appear more compressed. (Figure 4).

Figure 4: Gaussian source spectrum evaluated by a FTS.
Example 3: White LED Spectrum
The source is given a spectrum characteristic of a white light phosphor LED. The spectrum has a sharp peak at wavelength=0.45 um and a broad peak at wavelength=0.65 um. The blue peak corresponds to a spatial frequency of 2222.2 (1/mm). The red peak corresponds to a spatial frequency of 1538.5 (1/mm). Note that the recovered spectrum shape is flipped horizontally (Figure 5). This is because the spectrum is a function of wavelength, and spatial frequency the inverse of wavelength. Additionally, the recovered spectrum shows higher low-spatial frequency values than the original spectrum's red peak. Low spatial frequency intervals correspond to a larger range of wavelengths, and more light power will be integrated over these spatial frequencies.


Figure 5: White LED source spectrum evaluated by a FTS.
Conclusion
Modeling and operating a Fourier transform spectrometer in FRED is a straightforward process that highlights the advantages of FTS in spectral analysis. By following the steps outlined, users can effectively build and utilize an FTS model to analyze various spectra
____________________________________________________________________________________________________________________________________________________________________________________
This blog post was created based on the information provided by Photon Engineering, a partner of CBS Europe.
Download the PDF: FRED Application Note - Fourier Transform Spectroscopy