
Blog


Exploring Interferometry with FRED
In:
Interferometry is a key technique in optical science, allowing for precise measurements of wave interference, which can reveal intricate details about optical systems. This blog post explores how FRED software simulates interferometry, showcasing examples such as Poisson’s Spot, Michelson Interferometer, Newton’s Rings, and Fizeau Measurement of Lens Surface.
Introduction
The coherent irradiance feature in FRED allows for the simulation of physical optics phenomena, including diffraction and interference. This capability enables the accurate modeling and integration of components like Gaussian laser beams and interferometers into optical systems.
Example 1: Poisson’s Spot
Poisson's Spot, also known as the Arago spot, is a diffraction pattern produced when light passes around a circular object. In FRED, diffraction and interference calculations are performed using coherent beam superposition, which models arbitrary optical fields by coherently summing smaller fundamental beams, specifically Gaussian beamlets.


Figure 1: Poisson’s spot irradiance pattern. A 588 nm coherent plane wave source shines behind a circular obstruction with 0.1 mm radius. Coherent irradiance is evaluated at two different distances: 2 mm and 40 mm beyond the obstruction.
Example 2: Michelson Interferometer
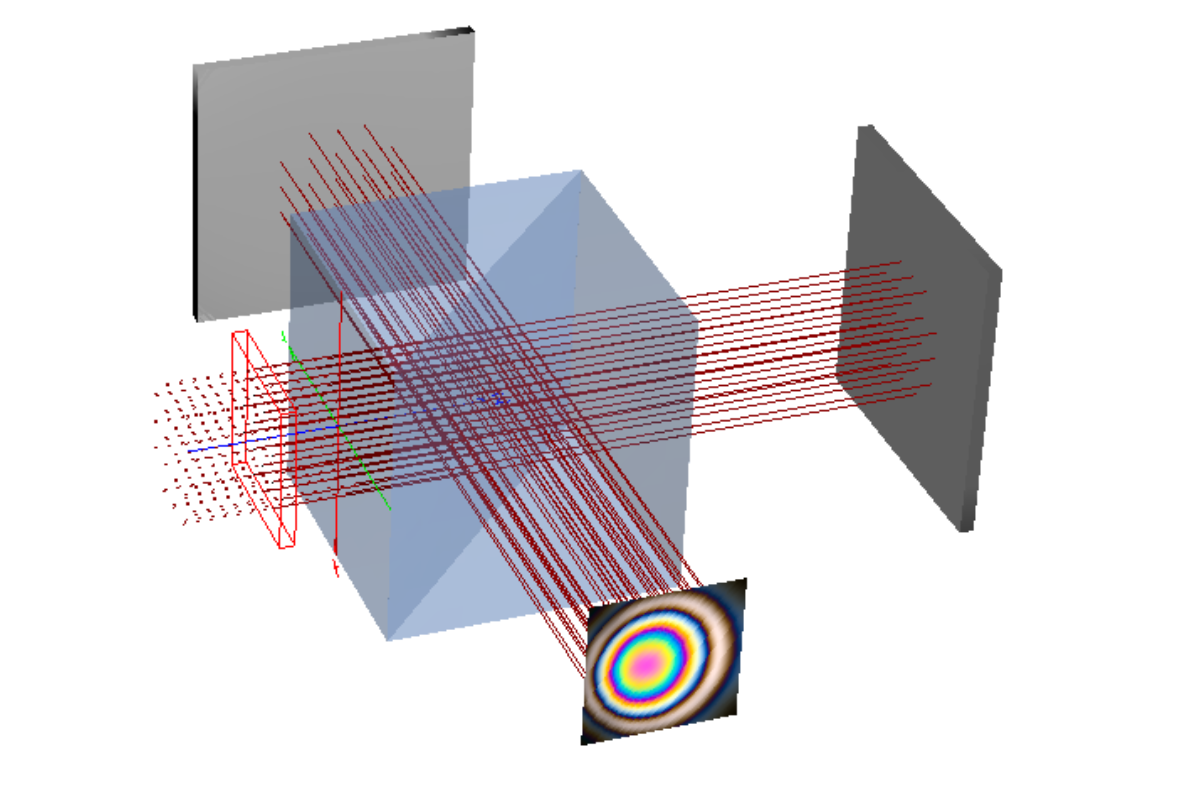
Interferometer systems can be modeled in FRED using coherent lights sources. A Michelson interferometer can be found in the Coherence folder of the FRED sample files. It consists of a coherent plane wave source, beam splitter to divide the input beam, flat reference mirror, and test mirror. The test mirror contains a defect which is modeled as a Zernike function. To add a defect, create a dummy surface which is not traceable. Open the dialog for the test mirror’s reflective surface and click on the Modifiers tab. Check Apply another surface’s sag as a deformation to this surface, and select the dummy surface. Lastly, check Deforming surface is applied in coordinate surface of the base surface. The coherent light source can be monochromatic or polychromatic; however, the maximum detectable defect is inversely proportional to the bandwidth of the source.

Figure 2: White light Michelson interferometer. A “white light” (405-669 nm) coherent light source is split by a cube beamsplitter. A color image shows white light fringes created by the test mirror modified with a Zernike polynomial function.
Example 3: Newton’s Rings
Newton's Rings are interference patterns caused by reflections between a spherical surface and a planar surface in contact. The pattern's rings increase as the optical path difference grows from the contact point outward.

Figure 3: Newton’s Rings. A slow (R=150 cm, D=1.25 cm) lens is placed in contact with a flat glass surface. Coherent, collimated “white” light (400-700 nm) shines from above, creating interference patterns.
Example 4: Fizeau Measurement of Lens Surface
Fizeau Interferometers are used in metrology to measure the surface quality of lenses and mirrors. In this example, a Fizeau Interferometer model measures the surface of a lens. The interference occurs between reflections from a reference optic and the test optic.

Figure 4: Fizeau interferometer for surface measurements. Laser light is expanded and collimated, and interference occurs between reflections from a reference optic and test optic.
Modifying the FRED File for Lens Metrology
To modify the FRED file in Figure 4 for lens metrology, the reference flat becomes a reference sphere and the test flat becomes a plano-convex lens. The reference flat has a back radius of -70. Its curved surface is transmissive and its flat surface is uncoated. The test flat a front radius of 80. It is relocated to a Z shift of 54.25. The imaging lens has a Z-shift of 150 and the detector has a Z-shift of 10. The test lens is located in its nominal wavefront, and a slight axial displacement of this lens leads to interference fringes (Figure 5).

Figure 5: Fizeau measurement of lens surface. When the lens is in its nominal wavefront, a null interferogram is formed. Axial displacement of the lens creates power fringes in the interferogram.
Conclusion
FRED software provides robust capabilities for simulating interferometry, allowing for detailed analysis and modeling of various optical systems. By following these examples, users can leverage FRED to explore and understand complex interference patterns and their applications in optical design and metrology.
References:
1. Arnaud, Jacques, “Representation of Gaussian Beams by Complex Rays”, Applied Optics, Vol. 24, No. 4, p. 538-543, Feb 1985.
____________________________________________________________________________________________________________________________________________________________________________________
This blog post was created based on the information provided by Photon Engineering, a partner of CBS Europe.